Glossary
Logout
©Copyright Arcturus 2022, All Rights Reserved.
7
Terms & Conditions
|
|
|
|
Security & Privacy
Contact
SWOT ANALYSIS


|Introduction
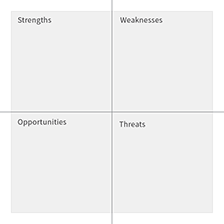
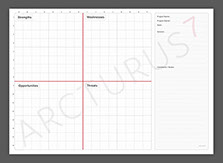
SWOT Analysis is a method to capture ‘internal’ and ‘external’ attributes from a strategic perspective. Appropriate analysis of the compiled Strengths, Weaknesses, Opportunities and Threats will lead in part to the formulation of a product strategy. SWOT Analysis as a process is recognised as a 'true marketing classic' and a traditional methodology to capture ‘internal’ and ‘external’ attributes from the business and commercial environment. However from our experience it is one of the most 'misused' / 'interpreted' models of all, even the seasoned strategic planner has put their own interpretation on how to conduct the actual analysis.
If reference points have not been communicated /agreed prior to a workshop the resultant analysis very quickly becomes confused and often meaningless. This is where the Interactive SWOT Analysis model comes into its own. ...everyone involved sings from the same hymn sheet, not only that they buy in to the problems and opportunities, become inspired and creative.
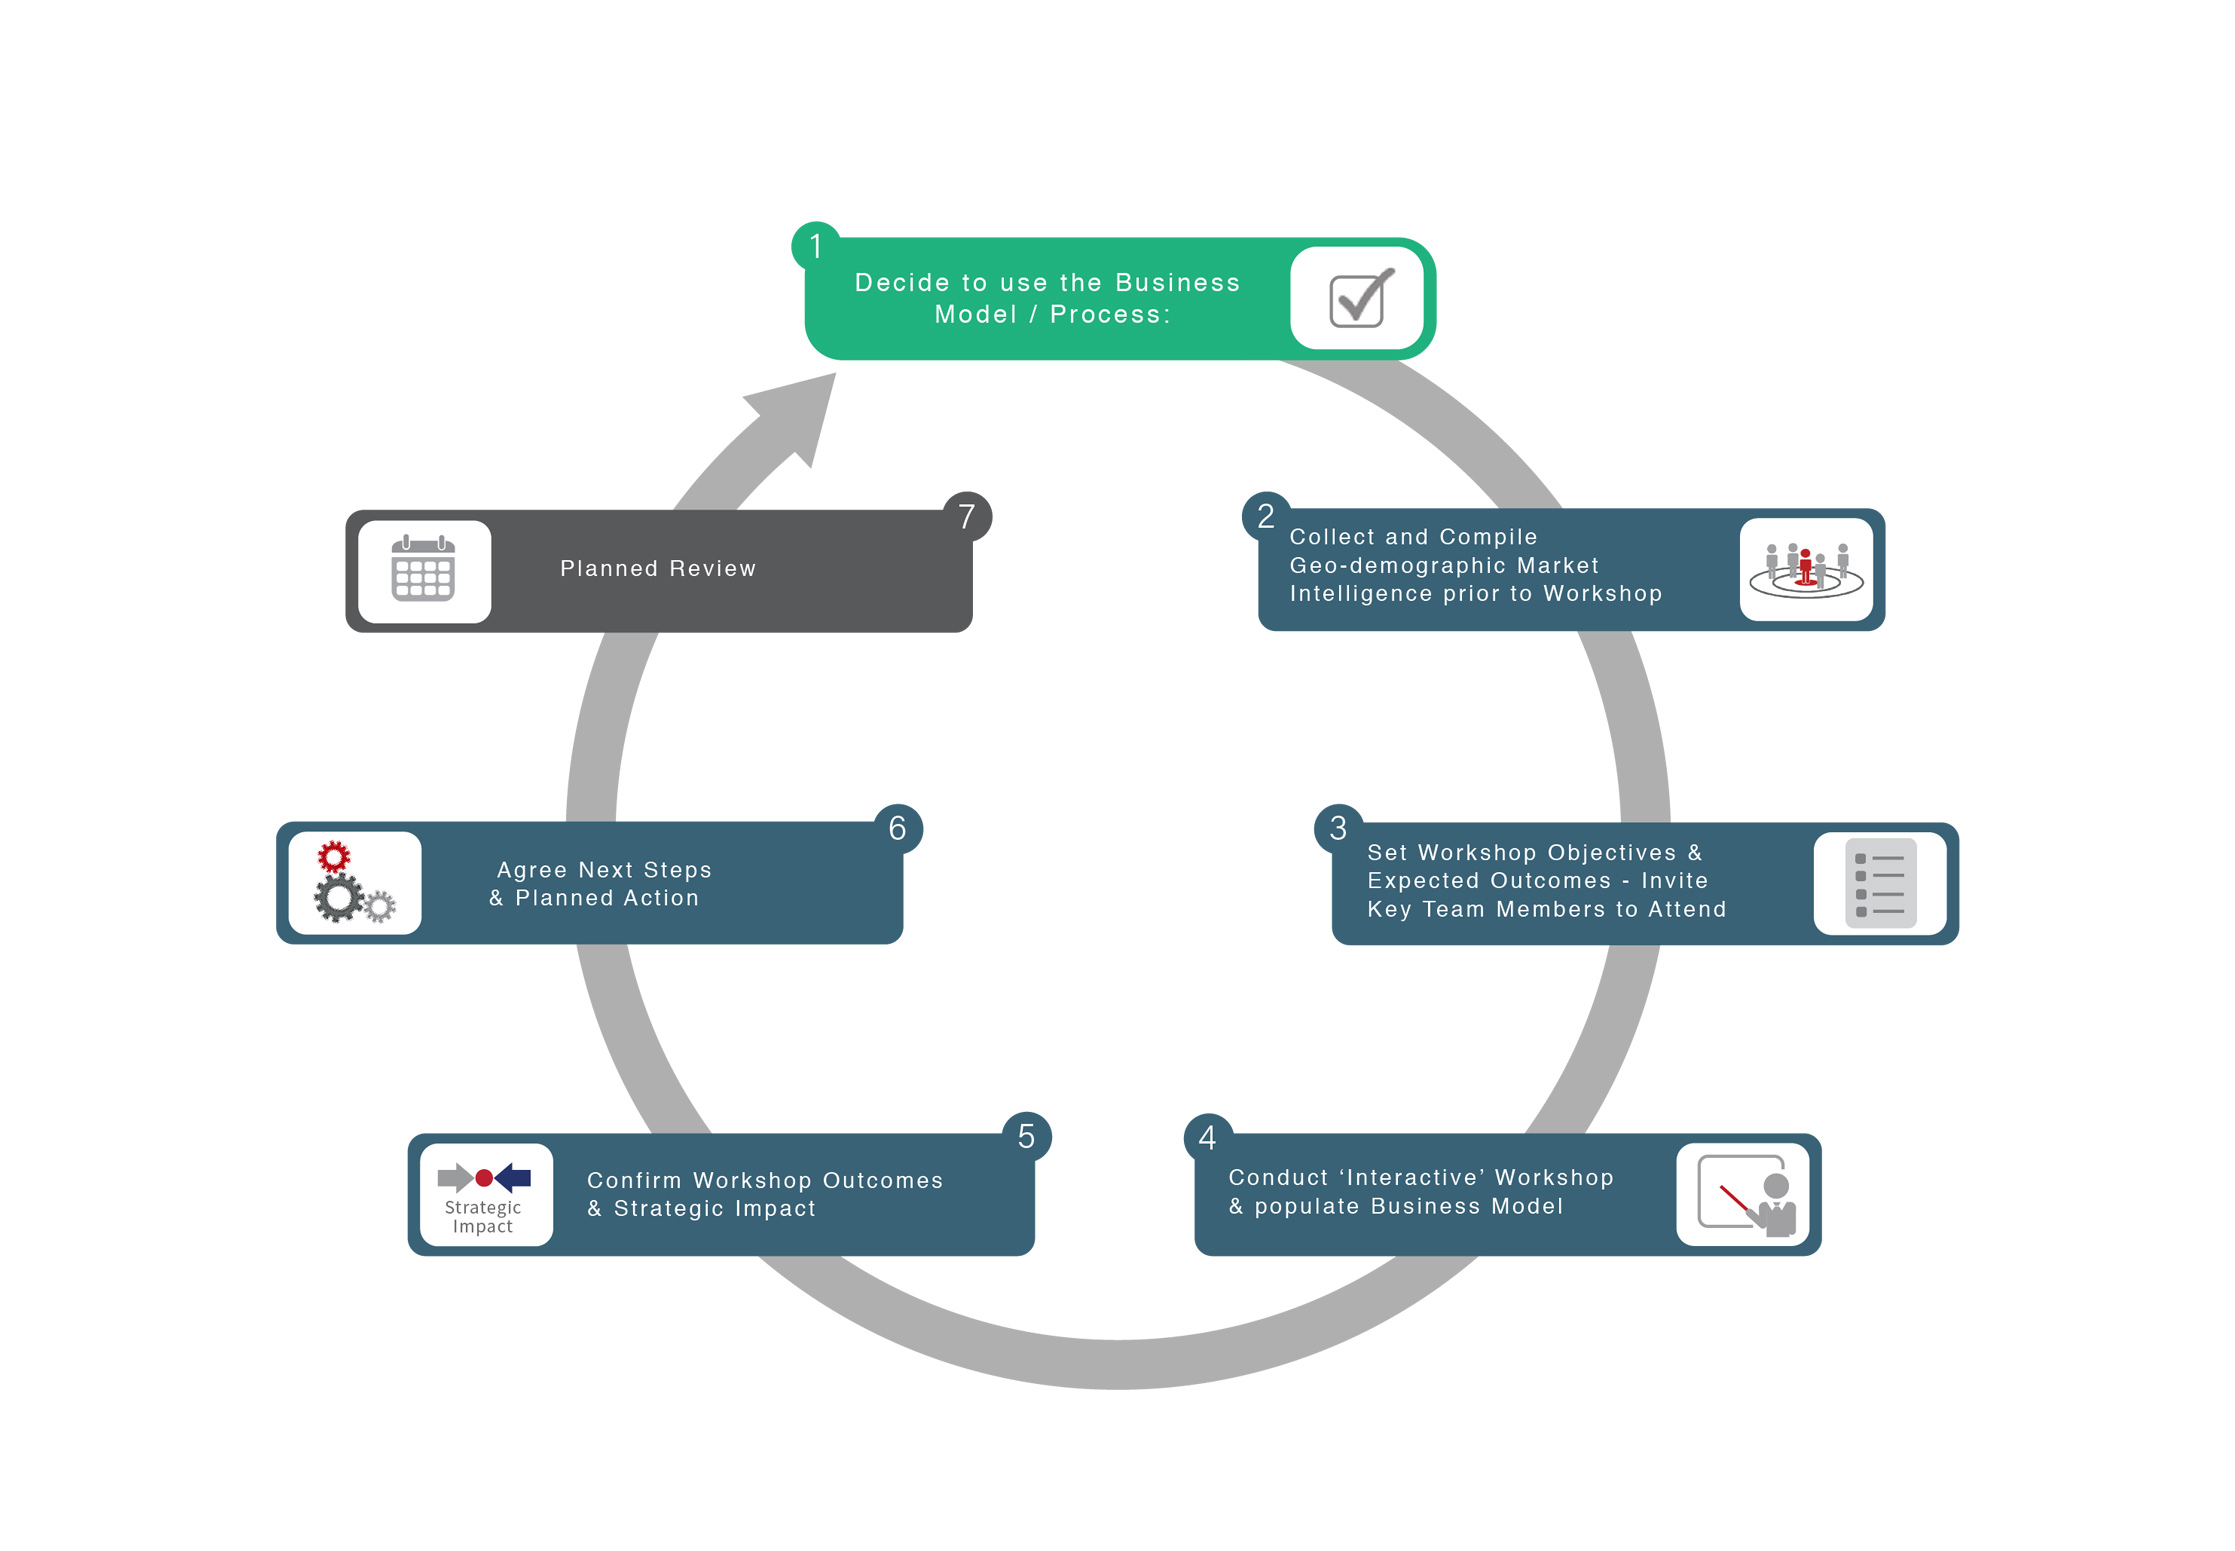
SWOT Analysis Interactive Mindmap:
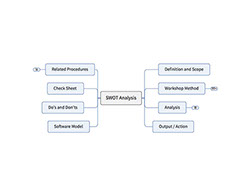
Interactive
Analysis Timeframe:
The timeframe associated with SWOT analysis is 'SNAPSHOT'.
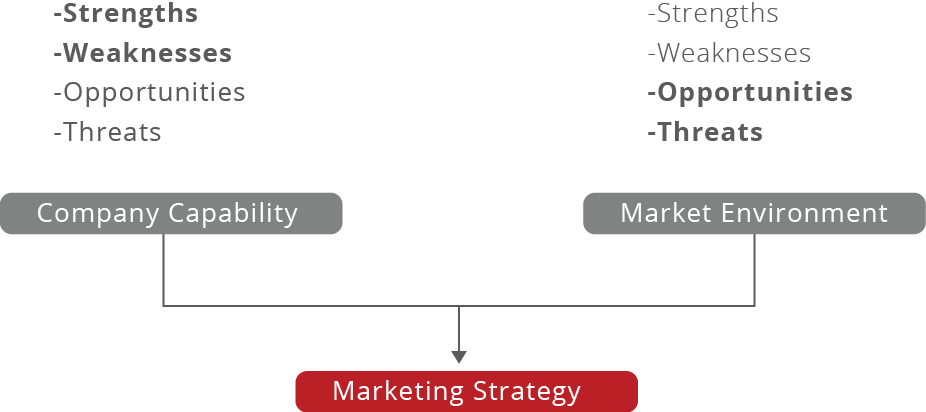
SWOT is considered as a 'situational analysis tool' and as such takes into account the business capabilities and market conditions from the perspective of 'today'.
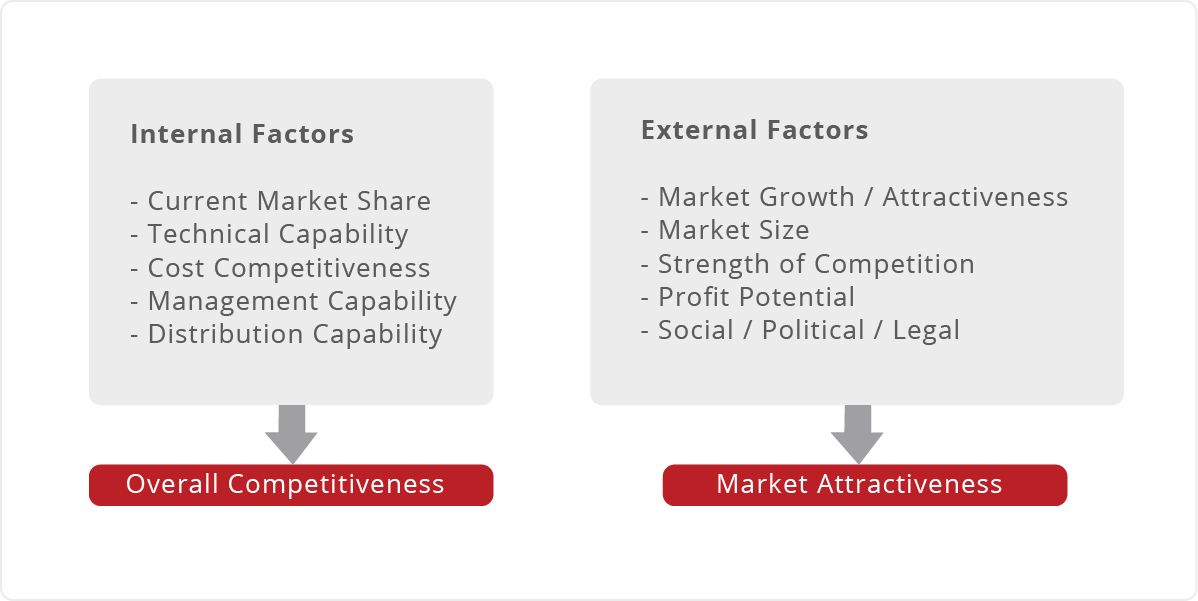
Internal and external factors lead to Overall Competitiveness and a view as to the Market Attractiveness as indicated;
State the SWOT Boundaries:
It is most important to understand both internal and external activities / conditions before embarking upon the SWOT analysis workshop. ‘Market research’ and ‘intelligence’ is therefore a prerequisite to the workshop itself. Appropriate project boundaries should therefore be defined / noted prior to a SWOT being undertaken.
It also worth noting that without clearly defined project boundaries and associated product objectives the analysis could be rendered useless.
Product Objectives:
State the objectives for the product...
Target Market:
State the intended target market for the product...
|Workshop Tasks and Who Should Attend...
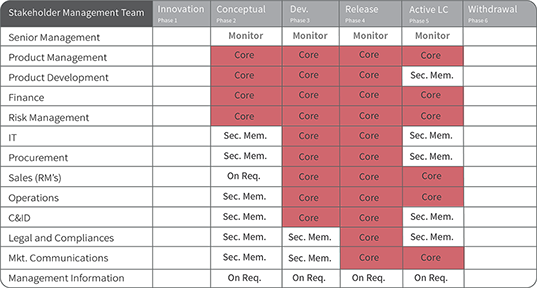

Key / Definition:
Monitor: Oversees the overall process, required to provide top level strategic objectives as required,
performs a management role.
Core: Defines the ‘Core’ team headed (chaired) by the Product Manager required to attend the workshop in alignment with the ‘Product Phase’. Membership is mandatory.
Sec. Mem: Secondary Membership defines an ‘on‐standby’ membership requirement and will depend upon the subject area, phase alignment and the project status. Membership is managed by the Product Manager.
On Req: On Request membership defines a membership that is managed by the Product Manager.
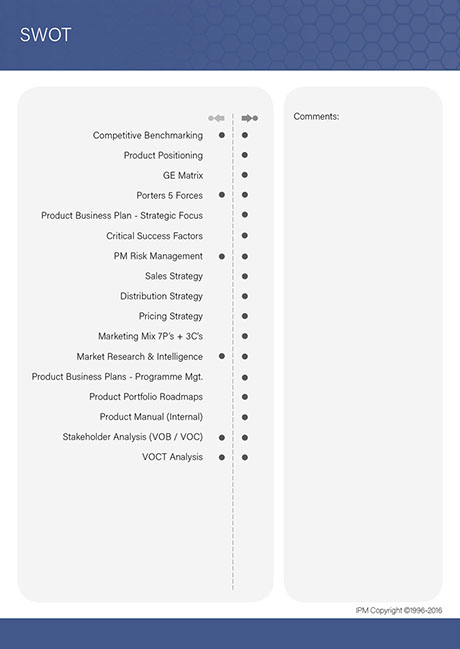
|SWOT Analysis Attributes
Each of the elements that make up a SWOT requires inputs from an appropriate cross functional management team.
It is important that attributes are described in a consistent way and are represented at the same hierarchical level. For example, do not explain Strengths at a lower descriptive level than identified Weaknesses... The resultant analysis will be skewed and inaccurate.
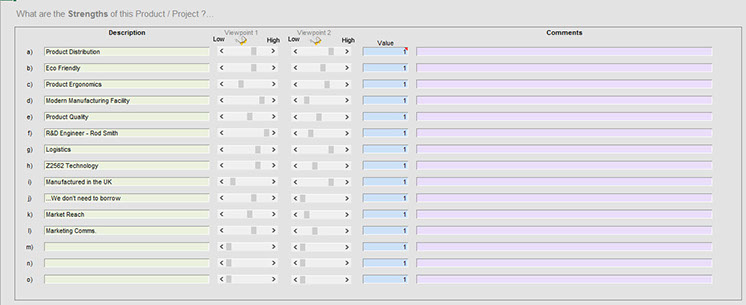
Strengths:
Generate / describe a list (up to 15) of ‘genuine’ (remember a Strength is only a Strength if the product is better than the competition) strengths for the product.
Places to look for Strengths:
- Product Attributes
- Service Processes
- Service Attributes
- Quality Aspects
- Company Processes
- Management Skills and Capability
- Marketing and Sales
- Market Territory
- Market Share
- Core Competence
- Manufacturing Capability
- Information Technology
- Intellectual Property
- Technology Capability
- Financial Aspects
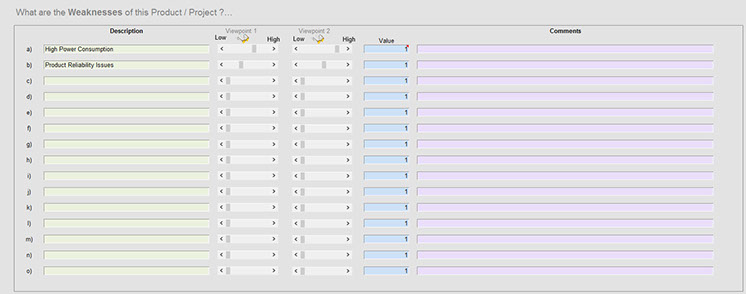
Weaknesses:
Generate / describe a list (up to 15) of ‘Weaknesses’ (a Weakness is an attribute which ultimately affects competitiveness) for the product.
Places to look for Weaknesses:
- Product Attributes
- Service Processes
- Service Attributes
- Quality Aspects
- Company Processes
- Management Skills and Capability
- Marketing and Sales
- Market Territory
- Market Share
- Core Competence
- Manufacturing Capability
- Information Technology
- Intellectual Property
- Technology Capability
- Financial Aspects
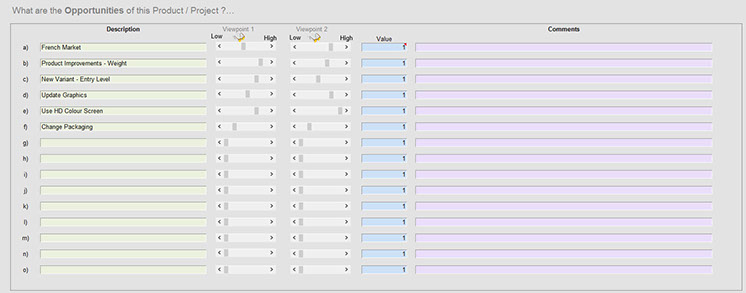
Opportunities:
Generate / describe a list (up to 15) of ‘Opportunities’ for the product.
To identify possible opportunities take a close look at your competitors Strengths and Weaknesses
.
Remember; A SWOT workshop is a snapshot in time and will identify ‘Weaknesses’ which afterwards could turn into opportunities do not ‘double account’ for these specific weaknesses at this stage.
Please Note: As the descriptive will be used as a label in the visual matrix please keep the descriptive as short as possible and use the ‘Comments box’ as required.
Places to look for Opportunities:
1. Product Attributes
2. Service Processes
3. Service Attributes
4. Quality Aspects
5. Company Processes
6. Management Skills and Capability
7. Marketing and Sales
8. Market Territory
9. New Markets
10. Market Share
11. Economic Trends
12. Core Competence
13. Alliances
14. Manufacturing Capability
15. Information Technology
16. Intellectual Property
17. Technology Capability
18. Financial Aspects
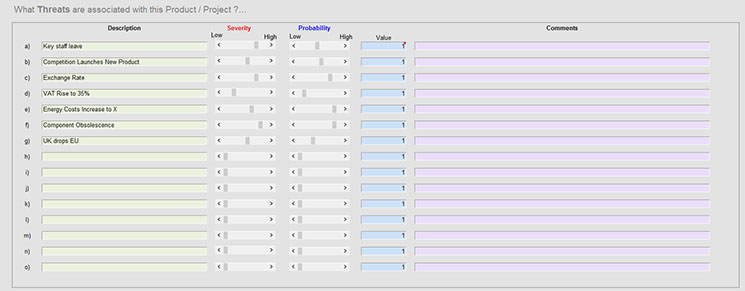
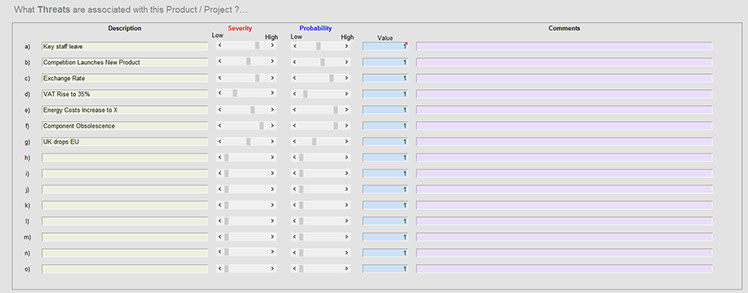
Threats:
Generate / describe a list (up to 15) of ‘Threats’ for the product / business. ‘Threats’ are attributes that are outside your direct control.
Places to look for Threats:
1. Product Attributes
2. Time to Market
3. Service Processes
4. Service Attributes
5. Quality Aspects
6. Competition
7. Company Processes
8. Management Skills and Capability
9. Marketing and Sales
10. Market Territory
11. New Markets
12. Market Share
13. Economic Trends
14. Core Competence
15. Alliances
16. Manufacturing Capability
17. Information Technology
18. Intellectual Property
19. Technology Capability
20. Financial Aspects
Rate SWOT Attributes:
Rating the SWOT attributes enables us to effectively dimension and prioritise each of the attributes in turn. This in turn represents a major deviation from the ‘traditional’ SWOT analysis which you may be familiar with. This new method now takes into account 2 viewpoints; For Strengths, Weaknesses and Opportunities they are represented as follows; Viewpoint 1 is an internal viewpoint and covers all aspects of the Company capabilities. Viewpoint 2 is an external viewpoint and represents the Customer base (or external to itself).
Threats are also treated to 2 viewpoints and take into account the Severity of the Threat and the Probability of the Threat happening. In other words a Risk assessment is automatically taking place during this analysis.
NOTE: It is important that you are consistent with your scoring.
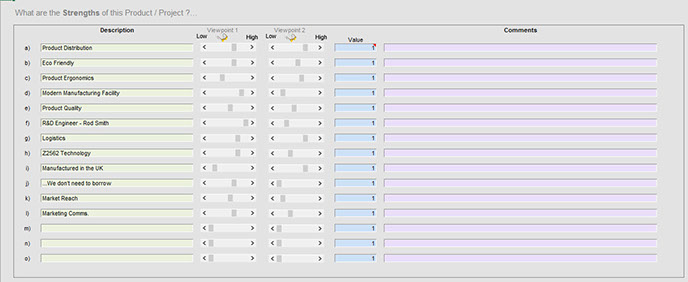
Strengths:
Rate the defined Strengths from both an ‘internal’ and ‘external’ perspective by moving the sliders as appropriate between a low & high rating (1 to 10).
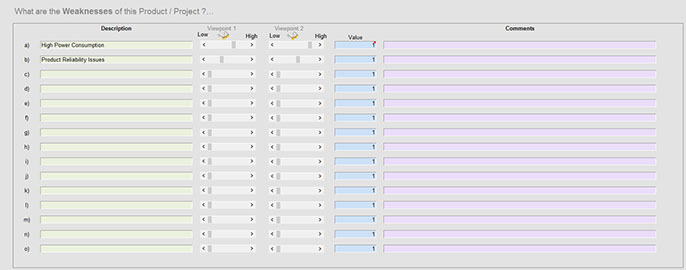
Weaknesses:
Rate the defined Weaknesses from both an ‘internal’ and ‘external’ perspective by moving the sliders as appropriate between a low & high rating (1 to 10).
Opportunities:
Rate the defined Weaknesses from both an ‘internal’ and ‘external’ perspective by moving the sliders as appropriate between a low & high rating (1 to 10).
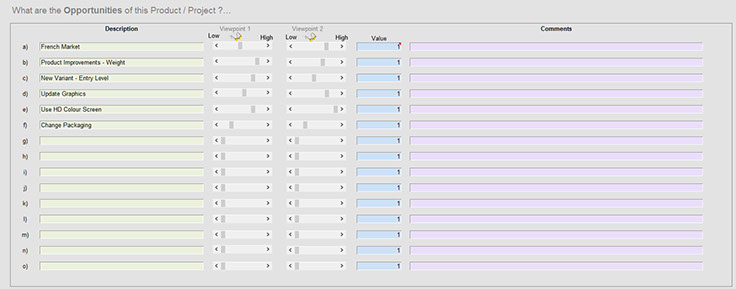
Threats:
Rate the defined Threats in terms of ‘Severity’ and ‘Probability’ by moving the sliders as appropriate between a low & high rating (1 to 10).
|Analysis
Once all elements of the SWOT have been entered the analysis can begin.
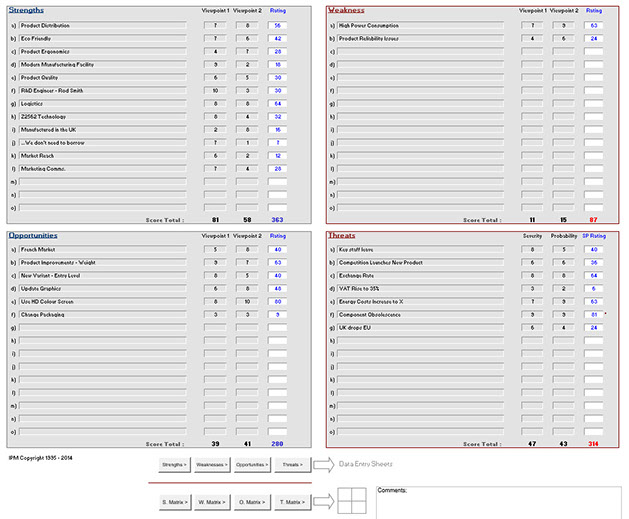
SWOT Analysis Summary:
The screen shot below shows a summary of collective Strengths, Weaknesses, Opportunities and Threats, together with the scores as implied by the weighting set by the sliders on the data entry.
Action: Cut and paste the SWOT summary into your product business plan.
Strengths Matrix:
The matrix below has been generated from data (Viewpoint 1 and Viewpoint 2) found under the ‘Strengths’. Each data plot uses the descriptive as the data label (this is why it is useful to keep the descriptive as short as possible). If you find that there are many label clashes, a duplicate plot with short labels is also provided together with an appropriate key.
To the ‘right’ of the Matrix is a collection of generic statements which may help in the formulation of your product strategy / tactics
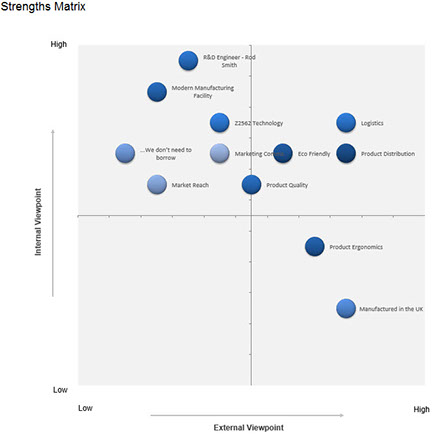
Strengths can be translated into Critical Success Factors as appropriate:
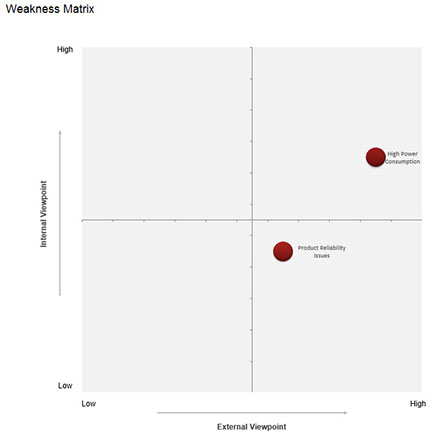
Weakness Matrix:
The matrix below has been generated from data (Viewpoint 1 and Viewpoint 2) found under the ‘Weakness’ entry sheets. Each data plot uses the descriptive as the data label (this is why it is useful to keep the descriptive as short as possible). If you find that there are many label clashes, a duplicate plot with short labels is also provided together with an appropriate key.
Action: Cut and Paste matrix in the Business Plan
To the ‘right’ of the Matrix is a collection of generic statements which may help in the formulation of your product strategy / tactics
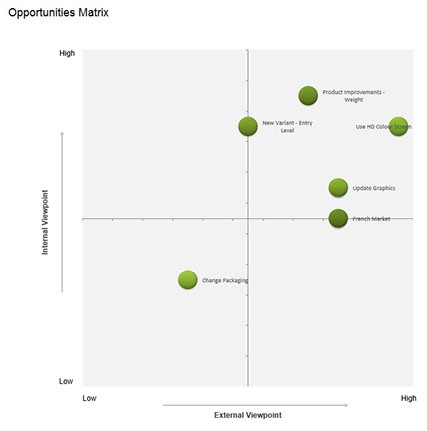
Opportunities:
The matrix below has been generated from data (Viewpoint 1 and Viewpoint 2) found under the ‘Opportunity’ entry sheets. Each data plot uses the descriptive as the data label (this is why it is useful to keep the descriptive as short as possible). If you find that there are many label clashes, a duplicate plot with short labels is also provided together with an appropriate key.
To the ‘right’ of the Matrix is a collection of generic statements which may help in the formulation of your product strategy / tactics
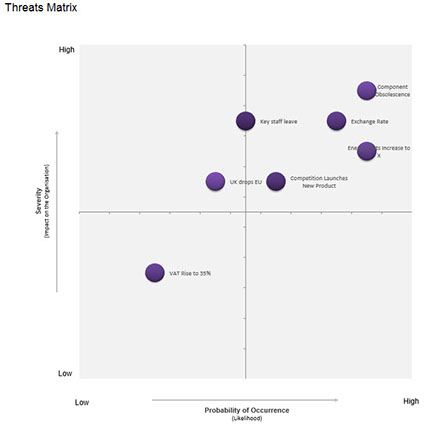
Threats:
The matrix below has been generated from data (Severity and Probability) found under the ‘Threats’ entry sheets. Each data plot uses the descriptive as the data label (this is why it is useful to keep the descriptive as short as possible). If you find that there are many label clashes, a duplicate plot with short labels is also provided together with an appropriate key.
Action: Cut and Paste matrix in the Business Plan
To the ‘right’ of the Matrix is a collection of generic statements which may help in the formulation of your product strategy / tactics
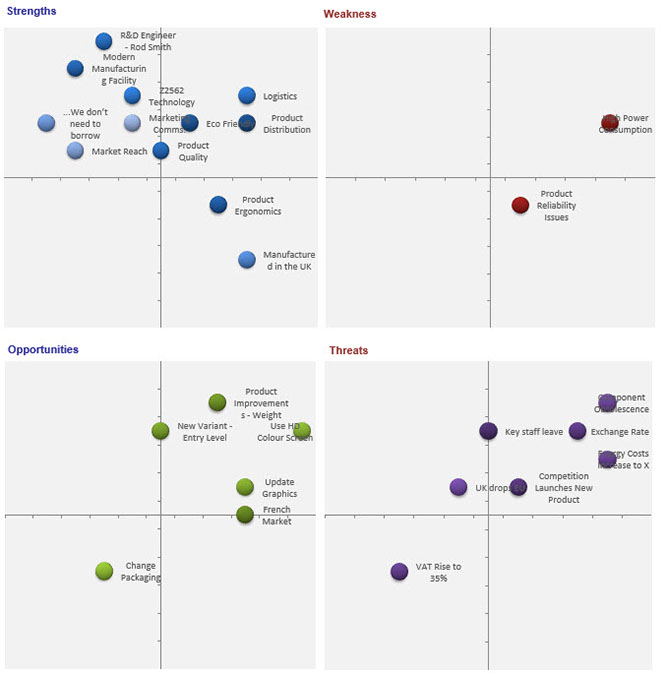
SWOT Matrix - Summary:
A collection of all 4 matrices (S.W.O.T) are presented in summary.
Each of the 4 matrices have been taken directly from the individual elements. Once again each data plot uses the descriptive as the data label (this is why it is useful to keep the descriptive as short as possible). If you find that there are many label clashes, a duplicate plot with short labels is also provided together with an appropriate key.
SW v's OT Ratio:
The SWOT business model automatically calculates the balance between the workshop identified ‘ +ve and –ve’ influences, these in turn relate to Strengths + Opportunities and Weaknesses + Threats respectively. The balance between the above ‘SW v OT’ indicates directly the current risk associated with the product / project.
Note: The label indicating the risk status can be turned off by un‐checking the ‘Full Label’ box.
|Related Procedures
The following interrelationship maps indicate; suggested content from other models/processes which may have influence or an effect on the analysis of the title process. The left-hand column indicates information or impact from the named process and the left-hand column indicates on completion of the process/analysis it may have an influence or effect on the listed processes.
Note: A complete set (professional quality) of PMM interrelationship cards are available to purchase - please contact us for further details.
|Do's and Don'ts
- Always conduct SWOT with inputs coming from a multidisciplinary team.
- When filling in the elements of the SWOT it is important that attributes are described in a
- consistent way and are represented at the same hierarchical level. For example, do not explain Strengths at a lower descriptive level than identified Weaknesses... The resultant analysis will be skewed and inaccurate.
- Remember to use up to date market research and intelligence data.
- Do not guess...
- Do not make up data...
- It may be helpful to produce a SWOT on each of your competitors – this will define any of their possible weaknesses and may lead to competitive advantages being developed.
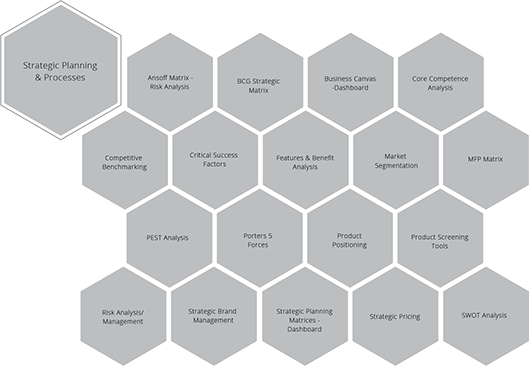
|Strategic Business Models, Workshop Tools & Professional Resources
The IPM practitioner series, is a definitive and integrated training programme for management professionals operating in the Product Management arena. So whether you’re the Managing Director, Product Director, Product Manager or a member of the Multidisciplinary Team we are confident that you will find this particular training series to be one of the best available and an invaluable asset to both you and your company.
PMM - Professional Support

Workshop Material


More
Interactive Business Models